Signal Engine
An AI-and-statistics platform that reads every customer support conversation, builds its own taxonomy, and turns a noisy queue into alerts, analytics, and answers a team can defend in a product meeting.
- Timeline
- 2025 — 2026
- Role
- Design · Engineering · Operations
- Core
- LLM reader + SQL statistics
- Surfaces
- Web · Mobile · Slack · PagerDuty
Support teams are the first to know when a product breaks — and the last to be heard. The evidence lives in thousands of unstructured conversations, so when it finally reaches a roadmap discussion it arrives as anecdote: “customers are mad about billing.” Product hears an opinion. Engineering checks the tracker and sees “low severity.” Nothing moves.
The tooling makes this worse, not better. Manual tags systematically undercount reality — in one audit, an issue a team believed was tagged appeared in just one of six relevant tickets. Dashboards answer “what happened last month,” never “is right now normal?” And surveys hear from almost nobody: typical B2B response rates sit near 12%, while every one of those silent customers is already explaining exactly what’s wrong — in the queue.
We had also lived the manual alternative. In a department handling 3.5 million tickets a year, building one reliable insight pipeline took a team of ten roughly six months and $50,000 in labor — three-week cycles, seven to ten iterations to reach target coverage — and it started going stale the day it shipped.
Real issue rate vs what manual tags reported
Typical survey coverage — conversations are 100%
One manual taxonomy rebuild, ten people, six months
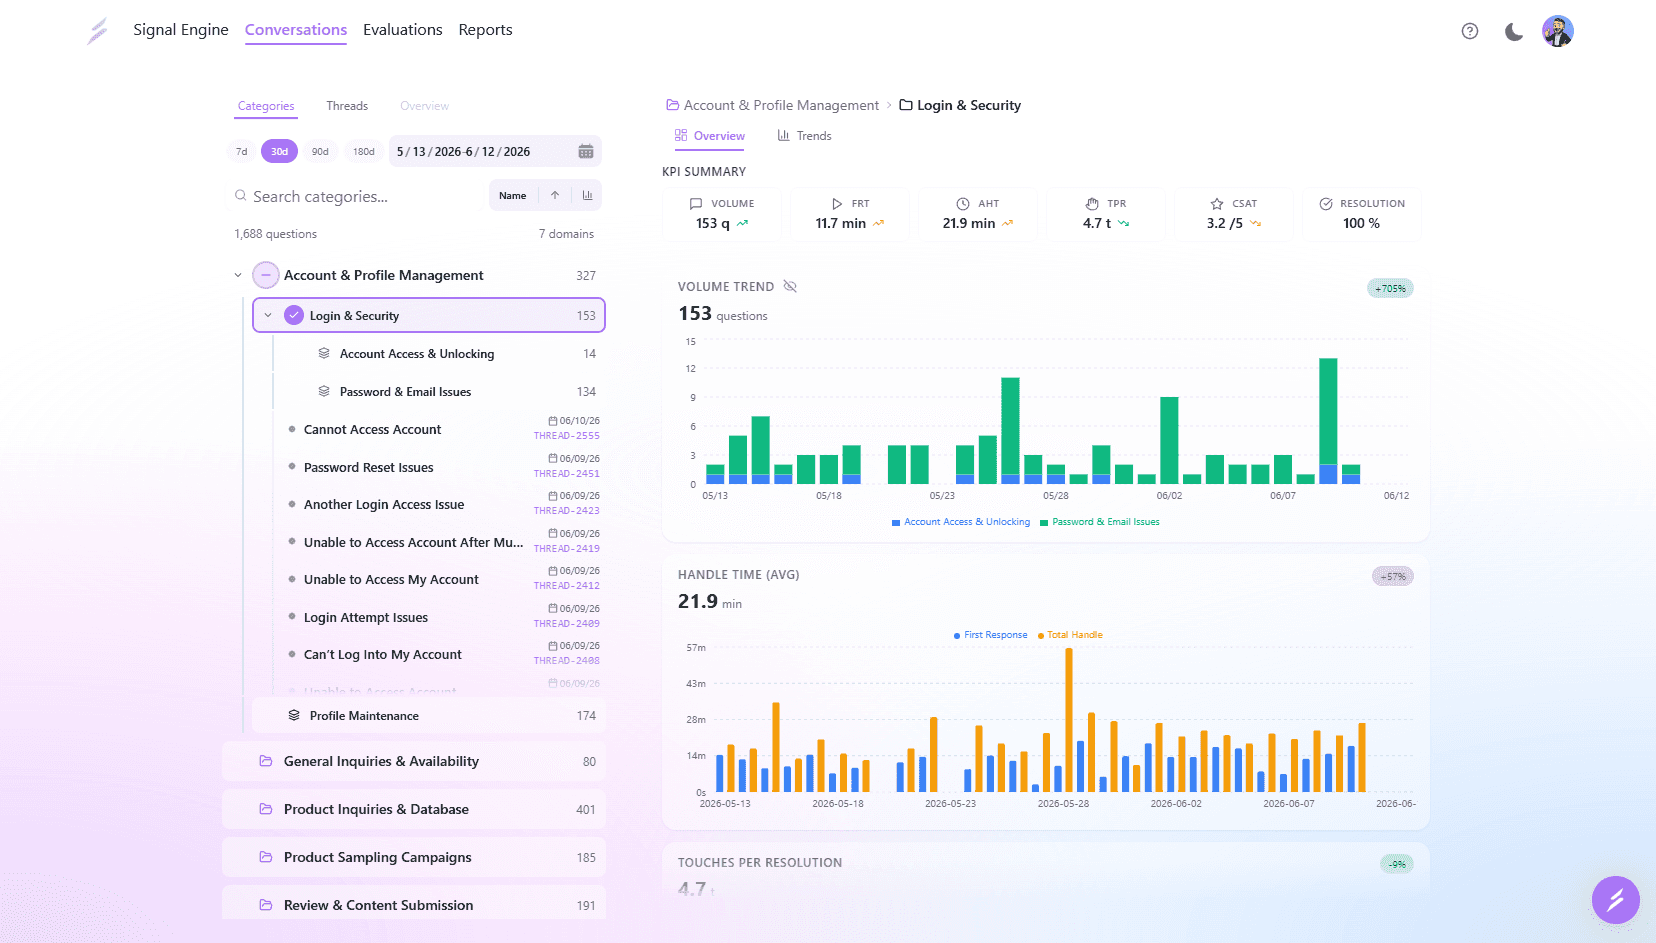
Signal Engine ingests every support conversation as it lands and reads each one the way a good analyst would — then never gets tired and never skims. It grows a hierarchical category tree out of the raw text, scores every conversation against a structured rubric, and layers statistics on top so that what reaches a human is signal, not vibes.
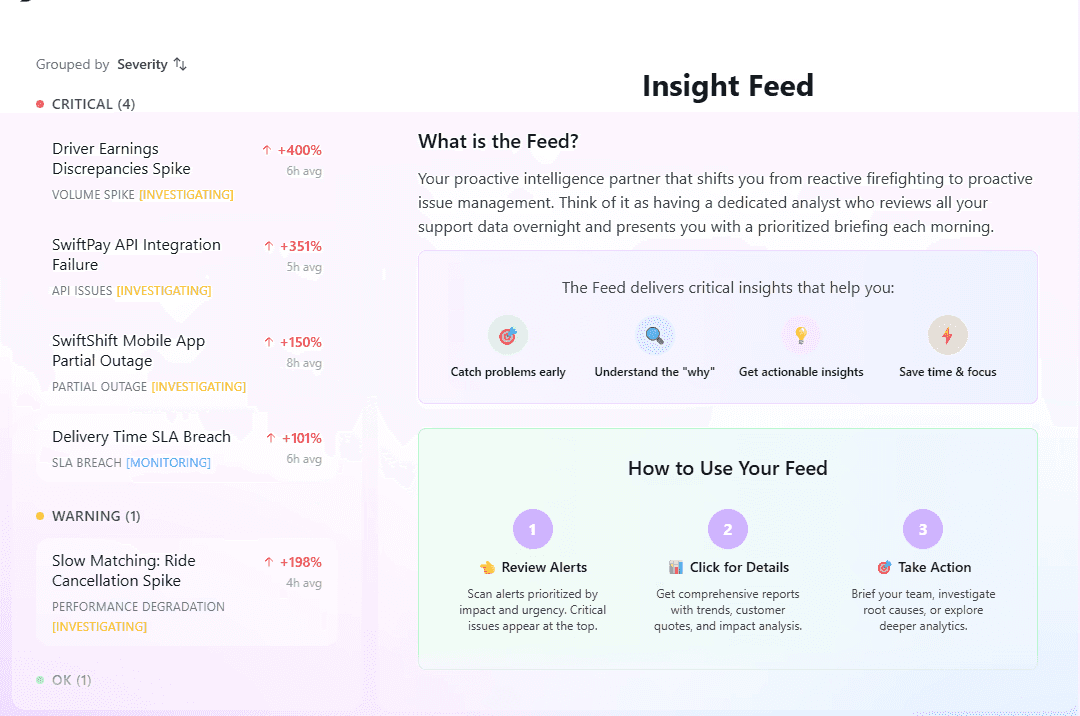
The work surfaces in three ways. A daily Insight Feed briefs the team each morning like an analyst who worked overnight — alerts grouped by severity, each carrying the “why,” the blast radius, and a recommended action. Drill-down analytics connect any alert to the exact conversations, customer quotes, and impact metrics behind it. And an agentic chat interface answers ad-hoc questions, runs multi-step investigations, and can be @-mentioned like a teammate.
Auto-taxonomy
A hierarchical category tree grown from raw ticket text — 1,688 questions across 7 domains in the demo workspace — with zero manual tagging, ever.
Statistical alerting
Six alert types over 30-day rolling baselines with day-of-week normalization and standard-deviation thresholds, checked hourly.
Insight Feed
A prioritized morning briefing: alerts grouped by severity with percentage deviations, blast radius, and investigation status.
Automated QA
Every conversation scored against a structured rubric — service experience, resolution quality, and custom criteria per team.
Agentic investigations
Multi-step analyses — churn drivers, product friction, volume surges — triggered from chat and delivered as report artifacts.
Delivery, not dashboards
Alerts pipe into Slack, PagerDuty, and internal tooling, plus a daily in-app digest. The signal meets the team where it works.
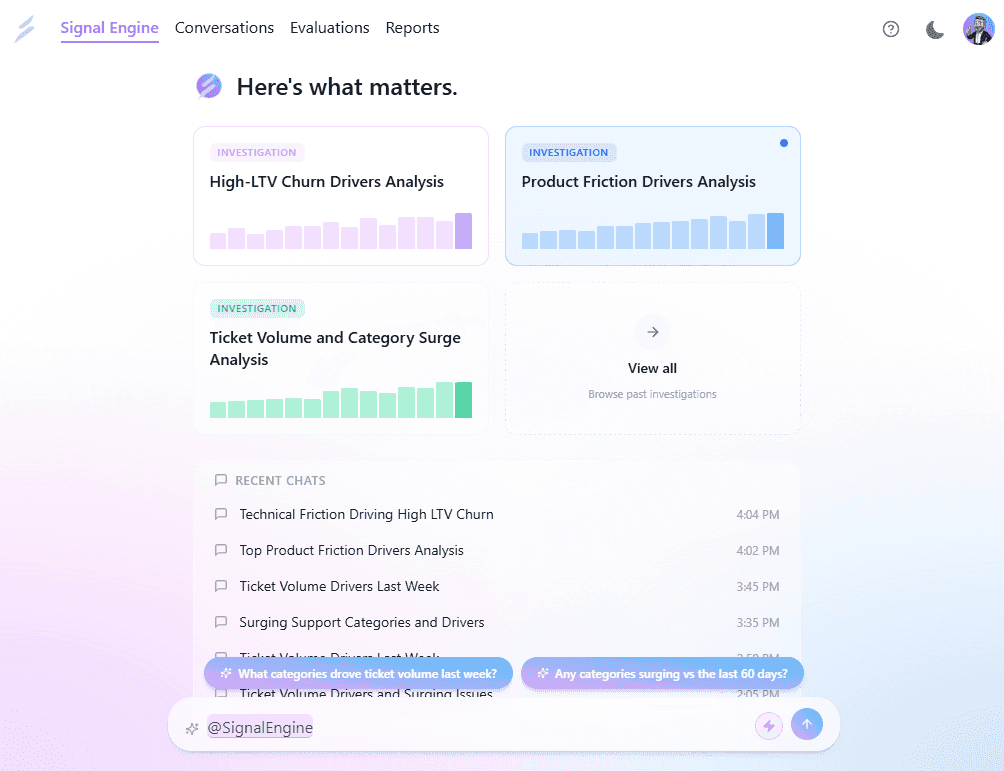
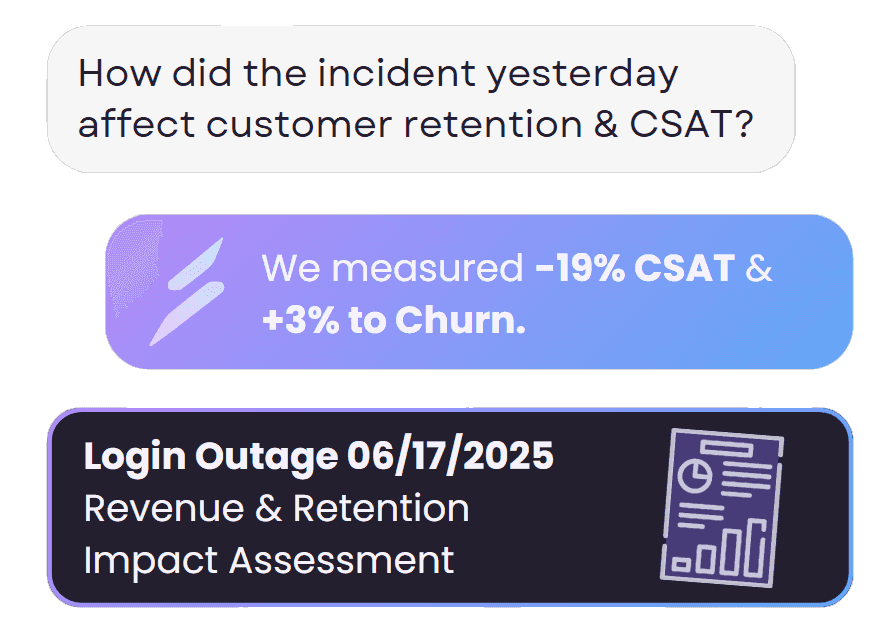
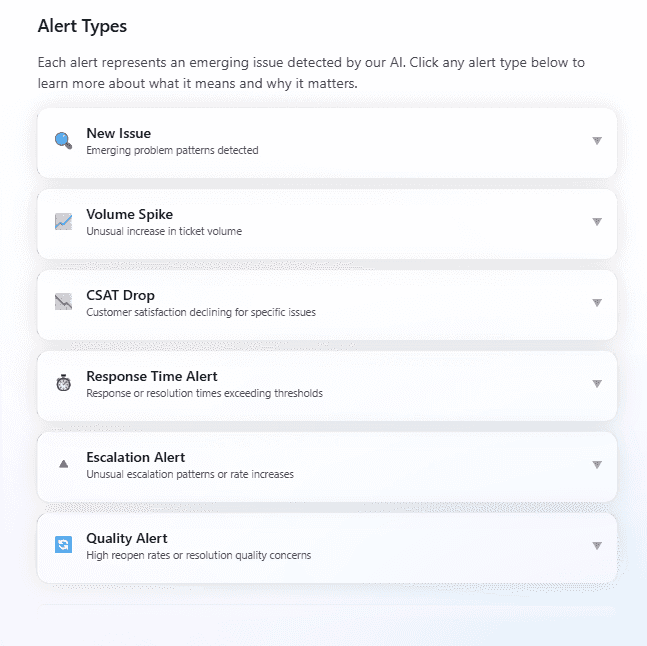
Quantified answers with report artifacts — “we measured −19% CSAT & +3% to churn” — and the six alert types the detector watches.
The architecture came out of a hard lesson learned building chat systems at scale: paste 500 tickets into a chat window and ask for trends, and you get an answer that sounds reasonable and is mathematically wrong. Language models are great at language and bad at math — ask one for the average sentiment of a thousand interactions and it will guess “7 out of 10,” because that’s the probable answer, not the computed one.
So Signal Engine uses the model only where fuzzy interpretation genuinely helps, and plain code everywhere else. Pointed at messy human language, the property people fear as hallucination is the useful one — imagination, the interpretive leap that turns “I keep clicking the button and I’m losing my mind” into a typed data point: high user effort.
The Reader
An LLM reads one conversation at a time — never in bulk — extracting sentiment, intent, friction, entities, and rubric scores into typed fields.
The Library
Every extraction lands as structured rows in an ordinary relational database. Boring on purpose: queryable, auditable, cheap to keep.
The Math
SQL and statistics over the store — rolling baselines, deviation thresholds, significance filters, severity × reach × duration ranking. No model in this loop.
On top of that store, the detector separates fires — a metric far outside normal today — from slow burns, the four-day drifts that become next week’s crisis, and ranks everything by severity, reach, and duration. A quietly worsening week outranks a one-day spike. It surfaces positive anomalies too, because a team should know when the numbers reflect its good work.
Just as deliberately, the system says what the data cannot answer — naming the missing dataset instead of manufacturing confidence. An instrument that answers every question isn’t a measurement instrument at all.
The proof of an instrument is what it measures. Three investigations, run on real production data, anonymized.
Silent churn isn’t loud
A marketplace wanted early-warning signs of account closure, so the engine read 14 weeks of support data — 18,900 tickets, 442 closure requests — and compared each closer’s previous 180 days of tickets against a random control group. The retention playbook says churners get loud before they leave. The data disagreed: only one in four closers had filed any prior ticket at all, their tickets matched the control across all fourteen churn-driver categories, and they scored highest on service experience — 45% ended on improving sentiment versus 30% for the control. Churners’ tickets end well.
The real lever was hiding in the closure tickets themselves: the deletion flow was broken, and two independent analyses converged on the same one-line fix — ask “why are you leaving?” in the form. Three in four closure tickets said nothing but “please delete my account.”
The dimension the helpdesk never stored
A marketplace with over a thousand independent providers kept hearing complaints about “certain providers” — but provider identity was never a field in the helpdesk. The engine extracted names, nicknames, and misspellings from raw ticket text, matched them against the roster, then applied small-sample and selection-bias corrections. Raw counts pointed at fifteen problem providers; the statistics cleared twelve of them. Three were genuinely elevated — and one of those traced back to a product bug, not the provider at all.
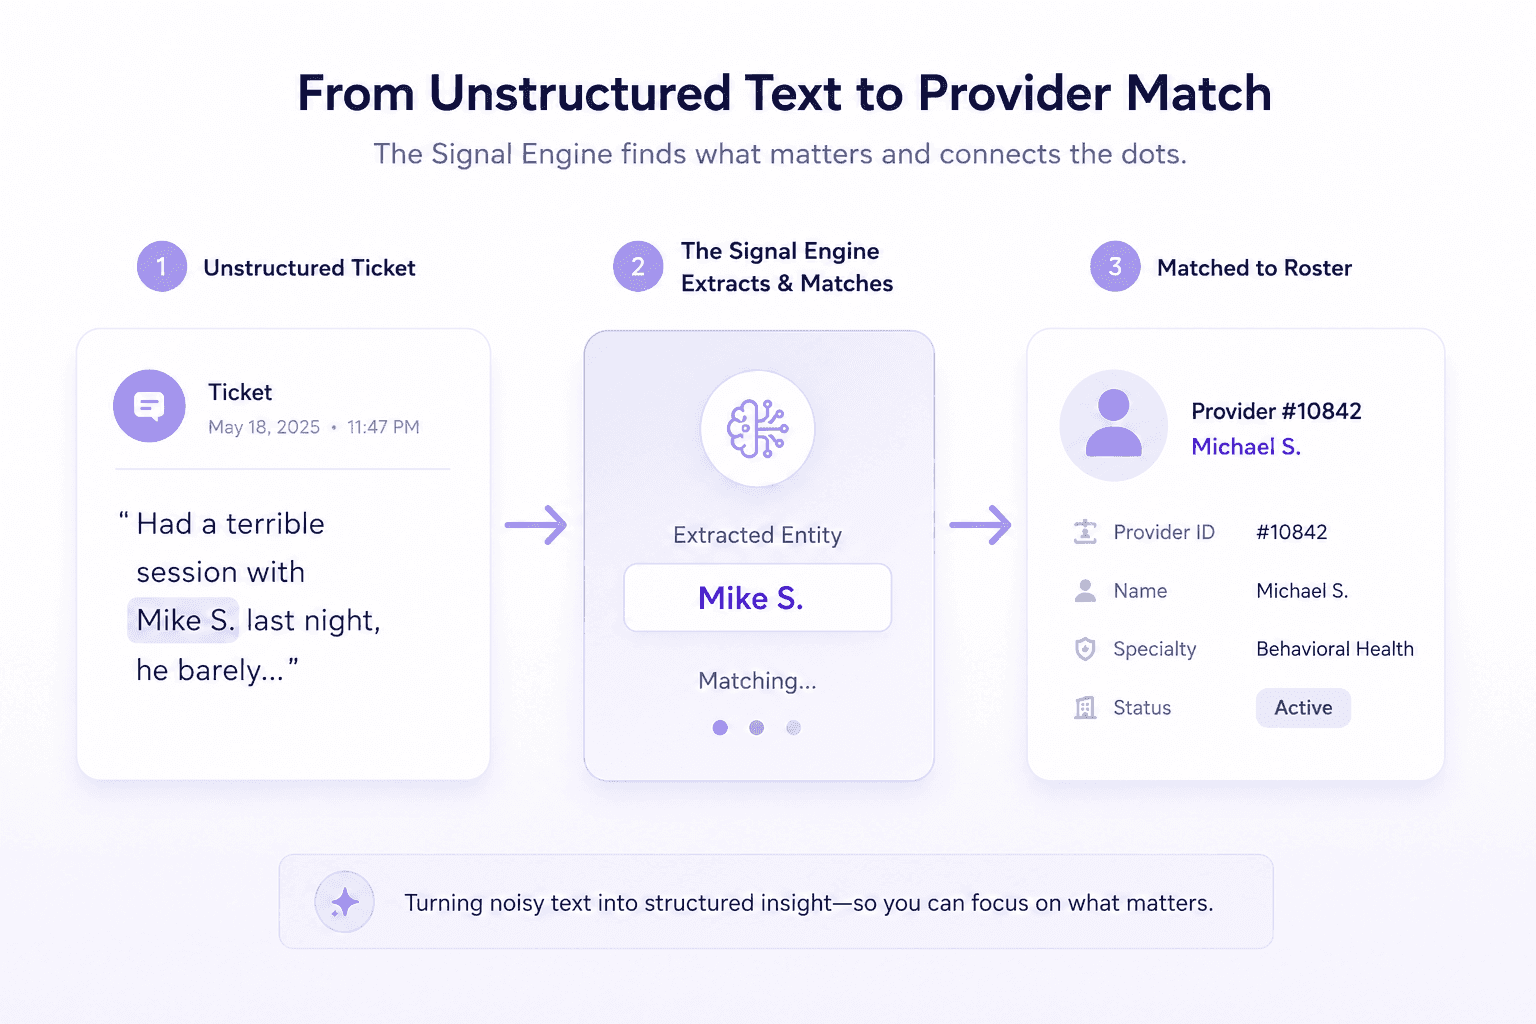
Shipping a fix isn’t fixing the problem
A subscription app shipped a fix for its top refund complaint and moved on. Weekly per-category measurement told a different story: complaints fell by a third, then stabilized at 5% of volume — double the expected 2–3% — and the trend line showed the fix decaying as agent adoption eroded. Half the anticipated impact, quietly evaporating. Cancellations didn’t move, which was honest too: the fix was never in scope for them. “Fixed” is a claim about a trend line, not about a deploy.
The model is the commodity. The harness is the product.
Signal Engine isn’t a chat wrapper. The value is the operational layer between raw conversations and the decisions they should drive — the schemas, baselines, rubrics, and delivery paths around the model. That’s also why it runs as a subagent: other agent systems call it to pull statistically validated context about support operations, the harness consumed as a service.
Never let the language model count.
Every number on every screen is computed by SQL over structured rows the model produced one conversation at a time. Interpretation and calculation are different jobs, and confusing them is how AI analytics tools end up confidently wrong.
Build interfaces for AI, not just for humans.
The agentic core isn’t a feature bolted onto a dashboard; it is the architecture. Investigations, @-mentions, and report artifacts exist because the next user of an analytics tool may not be a person at all.
Signal Engine was designed, built, and operated end-to-end by a two-person engineering team, alongside founders with fifteen years of support-operations experience.
Matt Young
Co-founder · CTO
Jacob Fry
Co-founder · Engineering
Product imagery shows a demo workspace with fictional data. Case-study numbers are real, drawn from anonymized production investigations.
Have data that isn’t talking?